QGIS-plugin "GNSSCad"
GNSSCad is a QGIS plugin for cadastral surveying with GNSS. The current version 0.3 is still considered a preliminary test-version.
Download latest testversion: GNSSCad 0.3 - december 2024 Added handling of static GNSS, and corrected several errors.
Download old testversion: GNSSCad 0.2 - october 2023 Corrected some errors in the adjustment procedure.
Download old testversion: GNSSCad 0.1
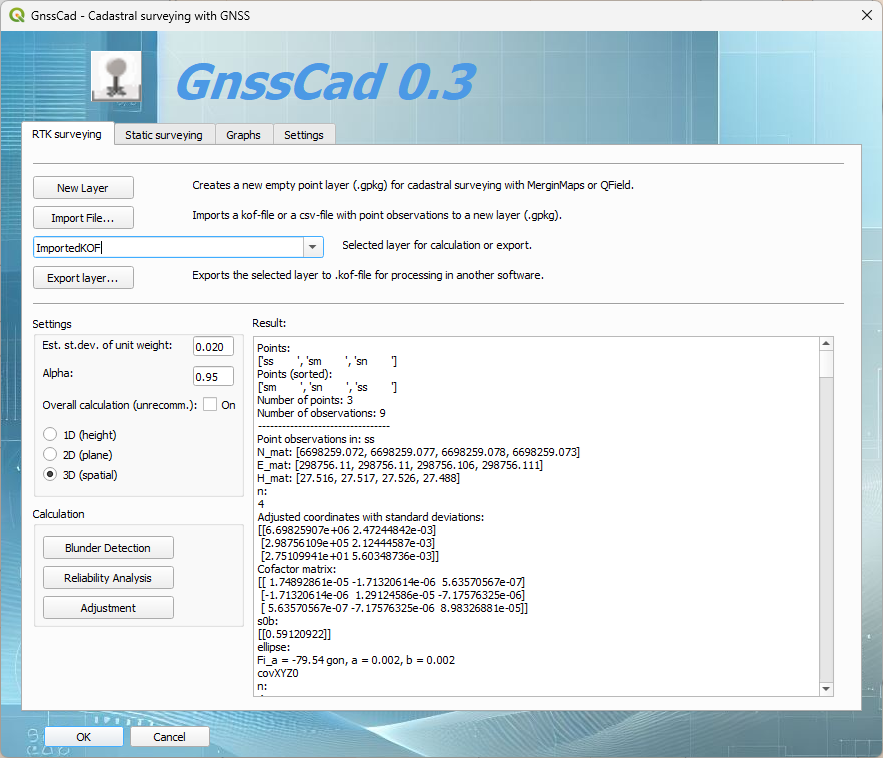
With this function it's possible to import .kof-files with GNSS point observations. Only lines 05, 46 and 47 are read. Line 51 will also be implemented in a later version. The kof-format is documented in KOF SPESIFIKASJON
Download testdata after surveying with Trimble R6 receiver, using the CPOS base network: Kronstad_pillars_R6.zip. Reference system is EPSG:25832.
The other supported import-format is .csv from the Emlid Reach RS2 GNSS-receiver. Download testdata Kronstad_pillar_ss_RS2.zip. Reference system is EPSG:25832.
For all observations with the same point name, median values for N,E and H is calculated using the numpy.median - function. Then distance from the median position to each observation is calculated. If the distance exceeds a certain limit, the observation is identified as a blunder.
When executing blunder detection, a new temporary layer is created in the QGIS project. The median positions are shown as black "+"-symbols. A red circle is drawn around the "+", indicating the limit between random errors and blunders. Point observations outside the circles are identified as blunders. When the temporary layer is made permanent, the symbology in the layer-panel will automatically update.
External reliability is defined as the impact on the adjustment, of a remaining blunder. With GNSS point observations, a blunder will consist of a coordinate triple, NEH. But in cadastral surveying in Norway, height is not registered. We are therefore only considering the impact in the ground plane, NE.
Concerning cadastral surveying in Norway, the limit for external reliability is never less than 10 cm. And when blunders further than 6 cm from median are removed, there is absolutely no chance for any remaining single blunder to alter the adjusted values more than 10 cm. This program function may be redundant except when cheaper consumer GNSS receivers are applied.
Adjustment is executed pointwise. Inverse variance-covariance matrix is used as weight matrix. Adjusted points are stored in a new temporary layer. They are symbolized with two triangles surrounded by an error ellipse. The size of the ellipse remains constant while zooming in and out. The ellipses indicate relative differences in accuracy between the points, and the direction with largest uncertainty for each point. When the temporary layer is made permanent, the symbology in the layer-panel will automatically update.
The plugin is made with the QGIS-plugin "Plugin Builder" assisted by the plugin "Plugin Reloader". The tutorial Building a Python Plugin (QGIS3) by Ujaval Gandhi has been of great help. The GUI is made with Qt Designer and the python programming is done with Anaconda and Spyder. Thanks also to Anne B. Nilsen at NIBIO/QGIS Norway for helping me getting started.
Helge Nysæter, Associate professor of land surveying, Institute for civil engineering, Western Norway University of Applied Sciences.
Last update: 9. december, 2024